
12. Appendix (Population Maps and tables)
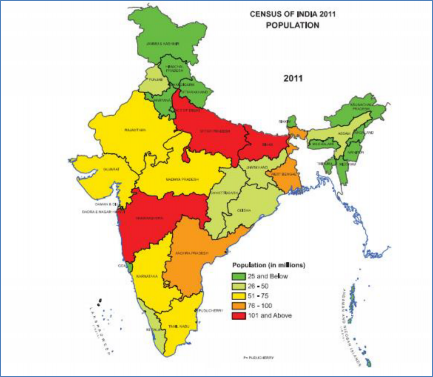
Fig. - S1
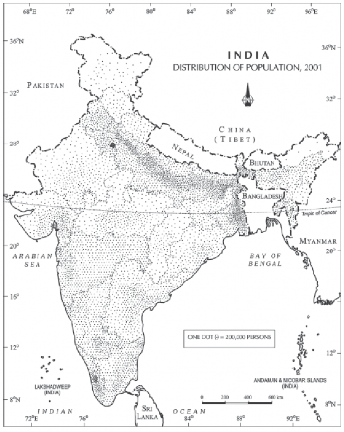
Fig. - S2
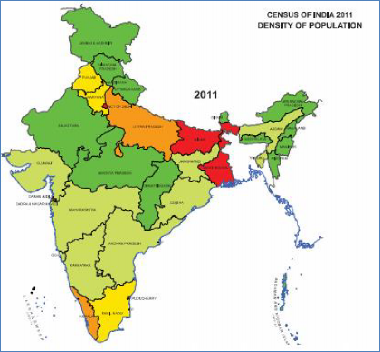
Fig. - S3
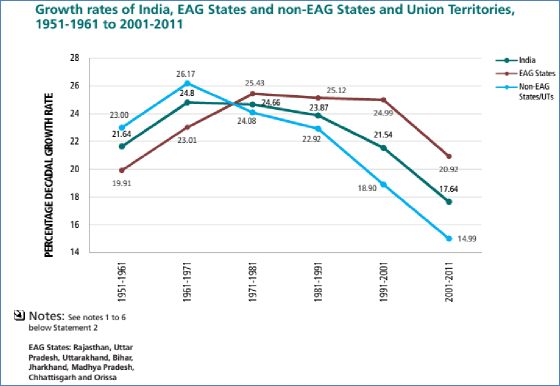
Fig. - S4
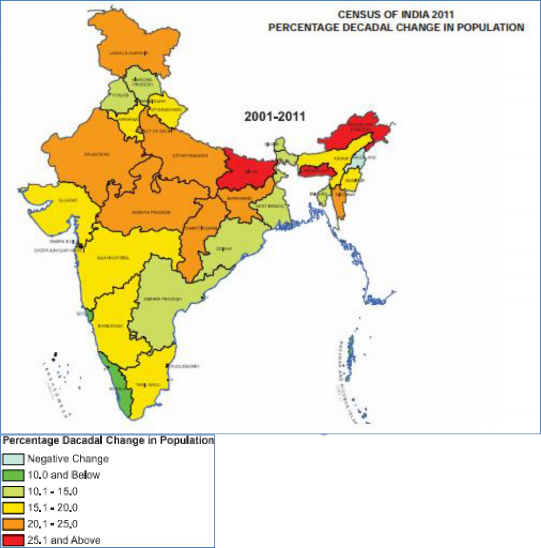
Fig. - S5
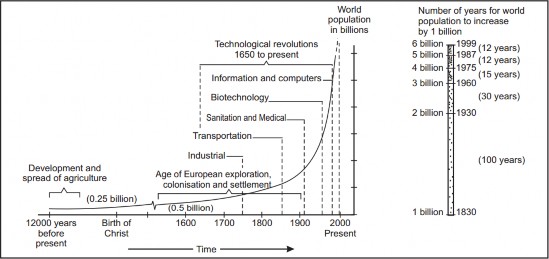
Fig S6
Trivia: Population Doubling Time: Population doubling time is the time taken by any population to double itself at its current annual growth rate.
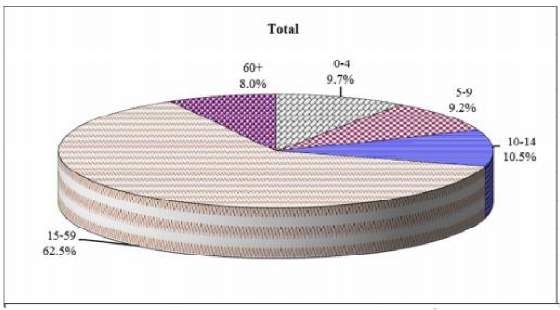
Fig. - S7 – Age Structure in India 2011
Fig. – S8
Fig. - S9
Fig. - S 10
Fig. - S 11
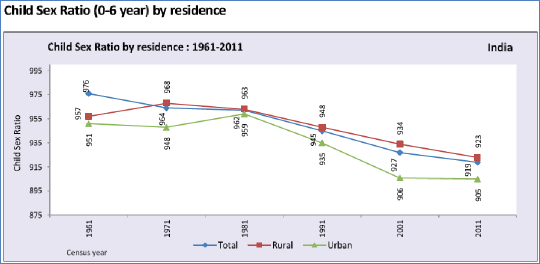
Fig. S 12
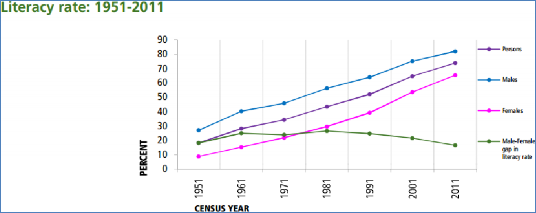
Fig. - S 13
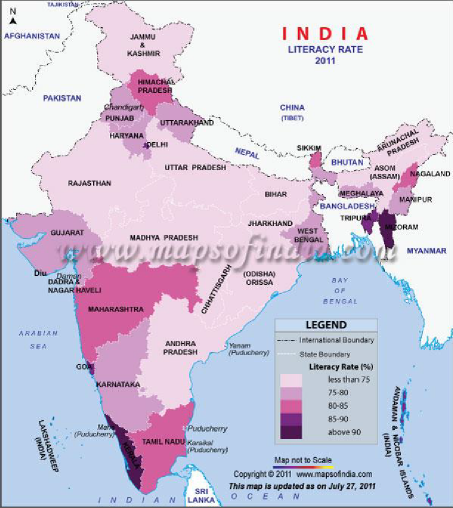
Fig. - S 14 – Literacy Rate – India 2011
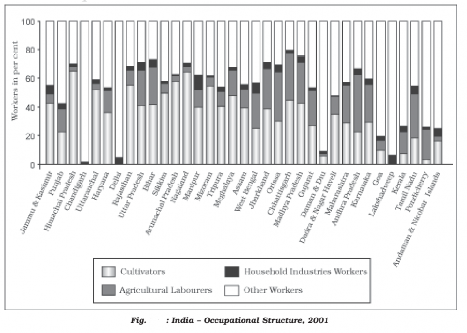
Fig S 15
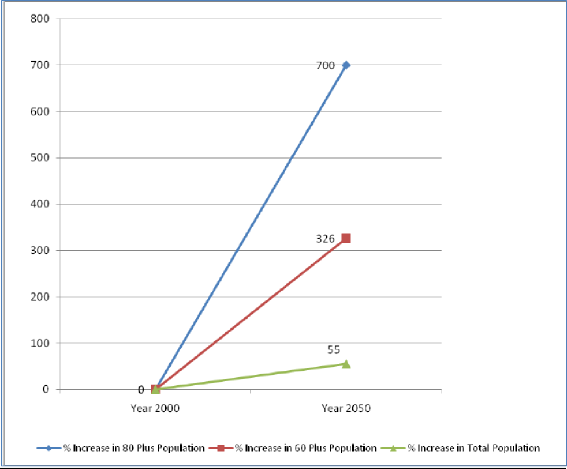
Fig. S16
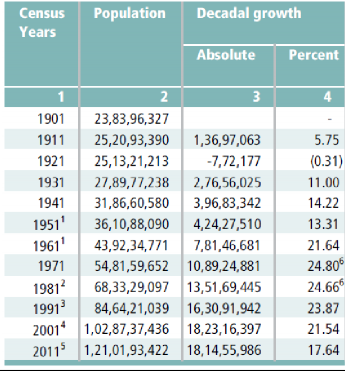
Table T1
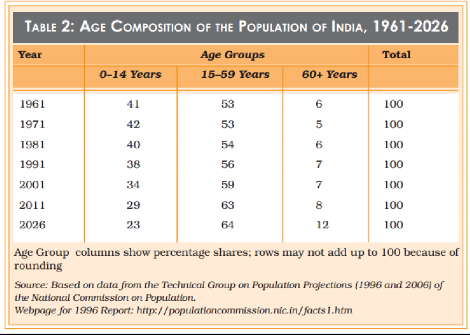
Table T2
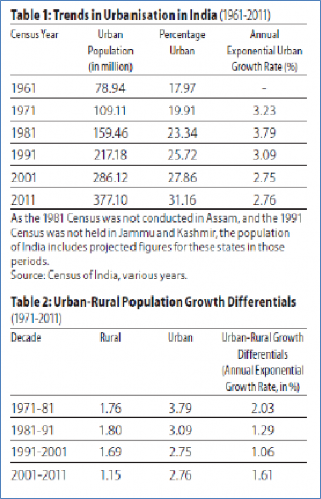
Table T3
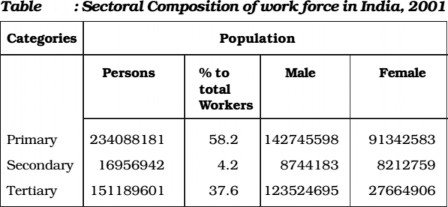
Table T4
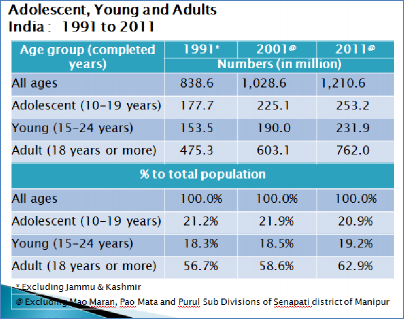
Table T5
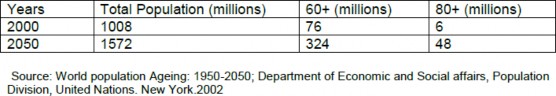
Table T6 – Old Age Population Projection
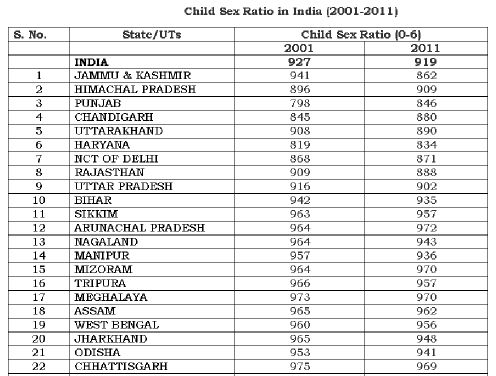
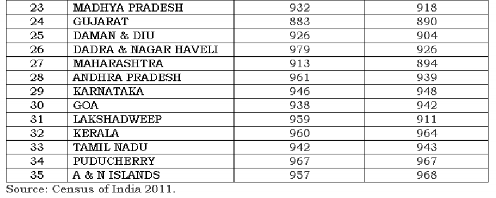
TABLE T6-CHILD SEX RATIO in DIFFERENT STATES
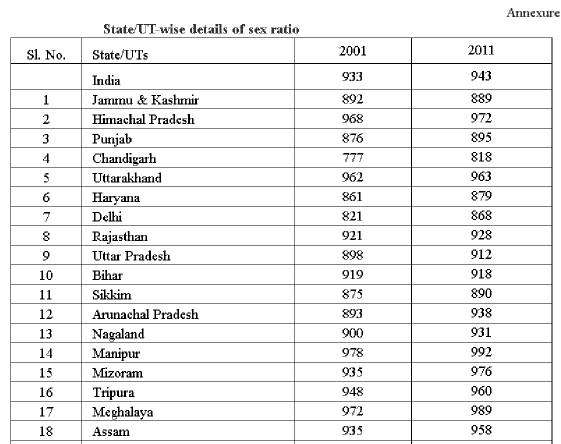
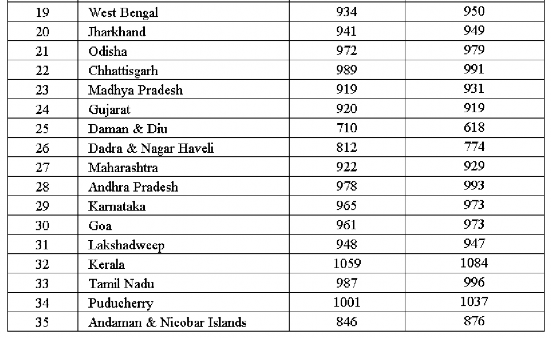
TABLE T7-ADULT SEX RATIO IN DIFERENT STATES
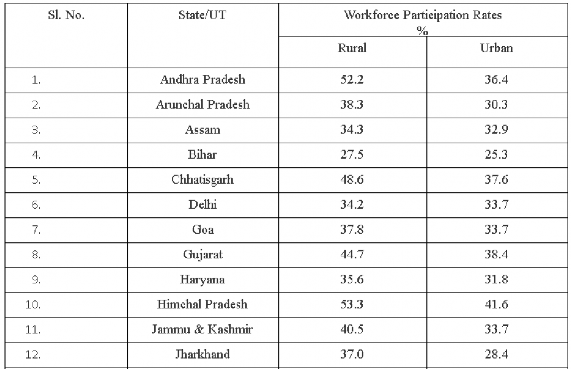
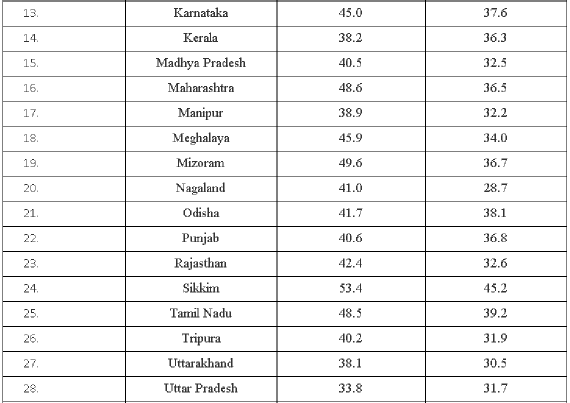
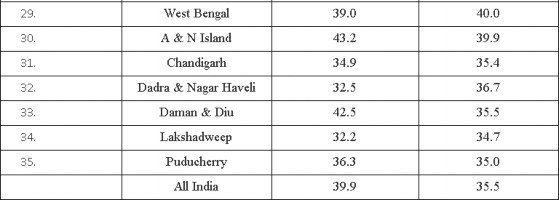
TABLE T8: State/UT-wise usual status (adjusted), Workforce Participation Rates (%) in the rural and urban areas in the country during 2011-12.
13. GS Mains Test Series Questions
1. Census 2011 indicates that there is a stark north-south divide with respect to the ongoing demographic shifts in India. Explain this phenomenon and discuss its policy implications for both northern and southern states?Answer:2. What is reproductive health? How does it differ from the existing family planning and maternal and child health programmes?Answer:3. Demographic Dividend, if not nurtured properly can become Demographic Disaster. Explain in the context of India.Answer:4. What are the reasons behind National Population Policy failing to check population growth in India?Answer:5. How does economic development influence the demography of a society? Discuss in the context of India.Approach:Answer:6. The uneven spatial distribution of population in India suggests its close relationship with physical, social and historical factors. Elaborate.Approach:Answer:Figure: Population density, 2011♤ Physical factors♤ Socio-economic and historical factors7. India was one of the first countries to explicitly announce an official population policy in 1952. Critically analyse various aspects of the population policy of the country over the years.Approach:Answer: