
1.5.3. Horizontal Distribution of Salinity
The salinity for normal open ocean ranges between 33 ppt and 37 ppt. In the land locked Red sea, it is as high as 41 ppt, while in the estuaries and the Arctic, the salinity fluctuates from 0 – 35 ppt, seasonally. In hot and dry regions, where evaporation is high, the salinity sometimes reaches to 70 ppt.
The salinity variation in the Pacific Ocean is mainly due to its shape and larger areal extent. Salinity decreases from 35 ppt - 31 ppt on the western parts of the northern hemisphere because of the influx of melted water from the Arctic region. In the same way, after 15° - 20° south, it decreases to 33 ppt
The average salinity of the Atlantic Ocean is around 36 ppt. The highest salinity is recorded between 15° and 20° latitudes. Maximum salinity (37 ppt) is observed between20° N and 30° N and 20° W - 60° W. It gradually decreases towards the north. The North Sea, in spite of its location in higher latitudes, records higher salinity due to more saline water brought by the North Atlantic Drift. Baltic Sea records low salinity due to influx of river waters in large quantity. The Mediterranean Sea records higher salinity due to high evaporation. Salinity is, however, very low in Black Sea due to enormous fresh water influx by rivers.
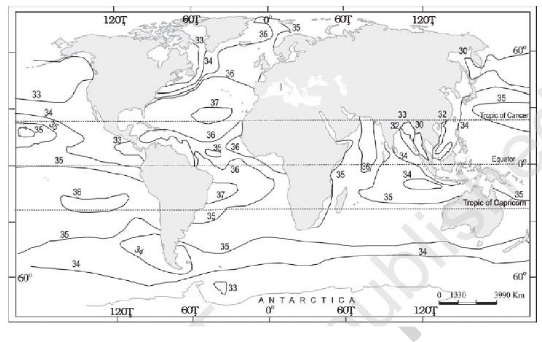
Figure 5. Surface salinity of World Oceans.
The average salinity of the Indian Ocean is 35 ppt. The low salinity trend is observed in the Bay of Bengal due to large influx of river water. On the contrary, the Arabian Sea shows higher salinity due to high evaporation and low influx of fresh water.