4.2. Pressure Variations
In the lower atmosphere the pressure decreases rapidly with height with decrease in density of air. It does not always decrease at the same rate. But to make calculations simple, a decrease of about 1 mb for each 10 m increase in elevation is taken into consideration (figure 11). In spite of high vertical pressure gradient, we do not experience strong vertical air currents. This is possible because of equal and opposite gravitation force acting upon air.
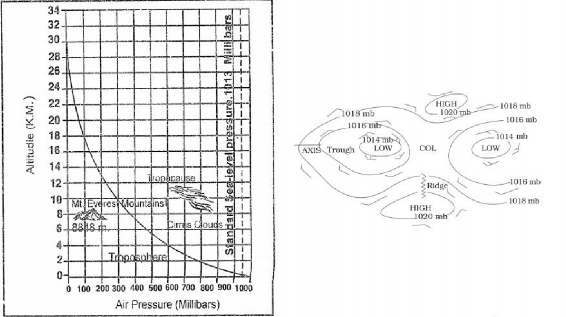
Figure 11 - vertical pressure variation Figure 12 - Isobars, High pressure and Low pressure system
The effects of low pressure are more clearly experienced by the people living in the hilly areas as compared to those who live in plains. In high mountainous areas rice takes more time to cook because low pressure reduces the boiling point of water. Breathing problem such as faintness and nose bleedings are also faced by many trekkers from outside in such areas because of low pressure conditions in which the air is thin and it has low amount of oxygen content.

Unlike vertical high pressure gradient, small horizontal pressure gradients are highly significant in terms of the wind direction and velocity. In order to eliminate the effect of altitude on pressure, it is measured at any station after being reduced to sea level for purposes of comparison. Figure 12 shows the patterns of isobars corresponding to pressure systems. Low pressure system is enclosed by one or more isobars with the lowest pressure in the centre. High-pressure system is also enclosed by one or more isobars with the highest pressure in the centre. The terms ‘high pressure’ and ‘low pressure’ do not usually signify any particular absolute values, but are used relatively.
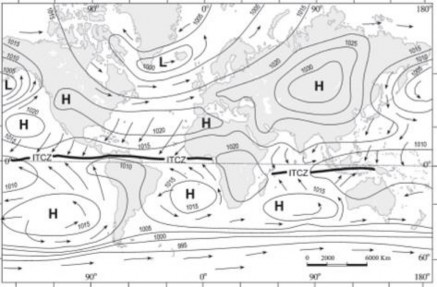
Sea-level pressure conditions over the globe for both January (figure 13) and July (figure 14) show some marked differences between the two hemispheres. The northern hemisphere tends to have the greater seasonal contrasts in its pressure distributions and the southern hemisphere exhibits much simpler average pressure patterns overall. These differences are largely related to the unequal distribution of land and sea between the two hemispheres. Ocean areas, which dominate the southern hemisphere, tend to be much more equable than continents in both temperature and pressure variations.