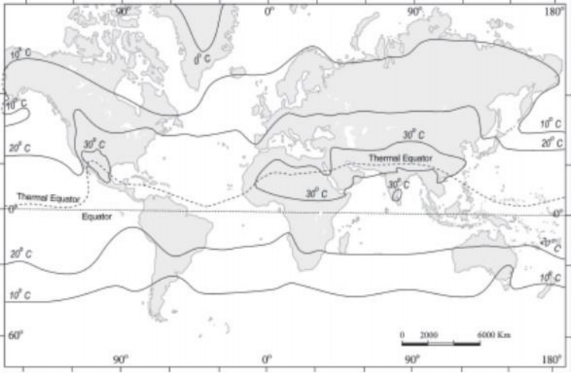
Figure 8 – isotherms in the month of January
♤ The isotherms are generally parallel to equator. They show successive temperature decrease towards the poles.
♤ The rate of change of temperature is indicated by the spacing between isotherms. Closely drawn isotherms indicate rapid change in temperature and vice-versa.
♤ The isotherms deviate to the north over the ocean and to the south over the continent in January. It is for two reasons – warm and cold ocean currents and difference between the temperature of land and water. For example, the presence of warm ocean currents, Gulf Stream and North Atlantic drift, make the Northern Atlantic Ocean warmer and the isotherms bend towards the north. Over the land the temperature decreases sharply and the isotherms bend towards south in Europe. The mean January temperature along 60° E longitude is minus 20° C both at 80° N and 50° N latitudes.
♤ In the southern hemisphere, the isotherms are more or less parallel to the latitudes due to less landmass and the variation in temperature is more gradual than in the northern
hemisphere. The isotherm of 20° C, 10° C, and 0° C runs parallel to 35° S, 45° S and 60° S latitudes respectively.
♤ In July the isotherms generally run parallel to the latitude.