
Geographical Distribution
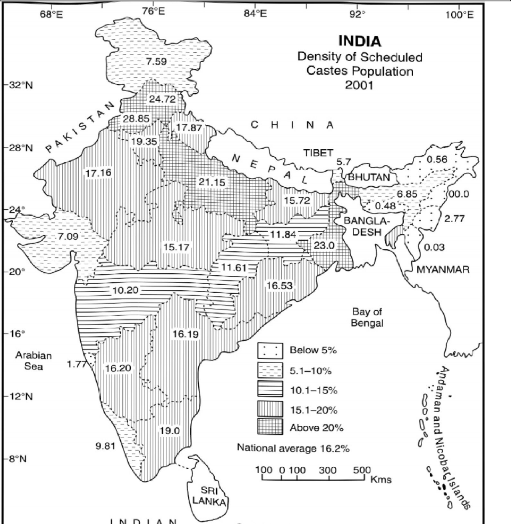
The geographical distribution and density of the Scheduled Castes has been shown in Fig. 13.11, The state of Uttar Pradesh has the largest number of Scheduled Castes population, accounting for about 21 per cent of the total Scheduled Caste population of the country, followed by West Bengal (11.1%), Bihar (7.83%), Andhra Pradesh (7.4%), Tamil Nadu (7.12%), Maharashtra (5.93%), Rajasthan (5.8%) and Madhya Pradesh (5.49%). In opposition to this, the state of Nagaland, and the Union Territories of Andaman and Nicobar Islands and Lakshadweep have no Scheduled Caste population (Fig. 13.11).
The highest percentage of Scheduled Caste population is found in Punjab (28.85 %), followed by Himachal Pradesh (24.72%), West Bengal (23.02%) and Uttar Pradesh (21.15 %). The states of Arunachal Pradesh, Goa, Mizoram, Meghalaya, Nagaland, Andaman, Nicobar, and Lakshadweep do not have Scheduled Caste population (Fig. 3.11).
The percentage of the Scheduled Castes is low in the areas of Schedued Tribes, Muslims, and Christians dominate regions/districts. The north eastern states of India, except Tripura have a very low percentage of the Scheduled Caste population. Similarly, the percentage of Sheduled Caste population is low where the percentage of Muslim and Christian population is high. Another important feature about the spatial distribution of the Scheduled Tribes is that they are mainly concentrated in the rural areas. Despite reservation and special programmes for their upliftment, over 90 per cent of them maintain a very poor standard of living.
Table 13.4 Scheduled Castes: Geographical Distribution, Census 2001
State | Total Population | Scheduled Caste Population | Percentage of Scheduled Caste to |
(’000) (’000) lotal Population in the State | |||
1. Andhra Pradesh | 76,210 | 12,339 | 16.19 |
2. Arunachal Pradesh | 1,098 | 6 | 0.56 |
3. Assam | 26,656 | 1,826 | 6.85 |
4. Bihar | 82,999 | 13,049 | 15.72 |
5. Chhattisgarh | 20,834 | 2,419 | 11.61 |
6. Goa | 1,348 | 24 | 1.77 |
7. Gujarat | 50,671 | 3,593 | 7.09 |
9. Haryana | 21,145 | 4,091 | 19.35 |
o
C E A N
Fig. 13.11 Density of Scheduled Caste Population, 2001
(Contd}
10. Himachal | |||
Pradesh | 6,078 | ||
11. Jammu & Kashmir | 10,144 | 1,502 | 24.72 |
12. Jharkhand | 26,946 | 770 3 1 RQ | 7.59 |
13. Karnataka | 52,851 | ||
8,564 | 16.20 | ||
a common heritage. The sense of cultural identity is most pronounced in a micro-region and becomes diffused in a macro-region.