
Main Features of Indian Railways
Railway Gauges There are four different types of gauges of the Indian railways. They are: (i) Broad Gauge (width 1.676 metres), (ii) Metre Gauge (width one metre), (iii) Narrow Gauge (width 0.762 metre), and (iv) Lift Gauge (width 0.610 metre). These gauges were designed during the colonial period keeping in mind the volume of traffic and goods movement. The major port cities were connected by Broad Gauge to facilitate the export of raw materials from India to Britain and the Commonwealth countries.
After Independence, the Government of India decided to convert all the gauges into Broad Gauge to facilitate the traffic and transport of goods. Prior to Independence, the whole railways system was under steam traction. Since it had poor efficiency and caused great environmental pollution the diesel engines were introduced in 1950s. At present, Diesel Locomotive Works (DLW), Varanasi (UP), Chitranjan Locomotive Works (West Bengal), and Mihijam and Tat
Engineering and Locomotive Works, Jamshedpur (Jharkhand), are producing diesel engines for railways. The diesel engines were also the cause of environmental pollution; therefore, in order to overcome the pollution problem and to cope with the growing pressure of traffic and goods, a decision was taken to switch over to electric traction all the important routes. In the electrification process, priority was given to high density sections ot railway lines. Of the two main segments of the Indian Railways, ((i) freight and (ii) passenger), the freight segment accounts for about 66 per cent of the revenues. Within the freight segment, bulk traffic accounts for nearly 95 per cent, of which more than 45 per cent is coal.
Distributional Pattern The distributional pattern of railway network is closely influenced by the terrain, topography, density of population, minerals, fertility of land, and arid and semi-arid climatic, conditions The railway network of the country has been shown in Fig. 12.4 while Table 12.2 shows the density of
railway-line per 1000 sq km of area in the major states Table 12.2 (Fig. 12.5). It may be observed from the Fig. 12.5 that the density of roads is significantly high in the Northern Plains of India while in the hilly states their density is very low.
Table 12.2 Length of Railways in Major States—2007
States | Railway length | per 1000 sq km | area | |
1. | Punjab | 42.78 | ||
2. | West Bengal | 41.85 | ||
3. | Bihar | 30.82 | ||
4. | Uttar Pradesh | 30.20 | ||
(Contd.'i
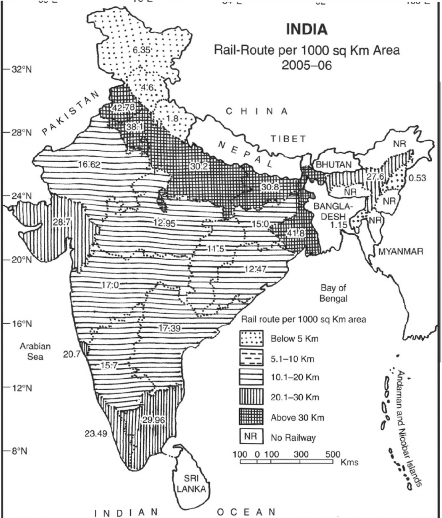
Fig. 12.5 Density of Railways
Railway Management The entire railway system is managed by the Railway Board. The railway network has been divided into 16 railway zones which are
subdivided into divisions (Table 12.3). These divisions are the basic operating units for the Indian railways.
Table 12.3 India—Railway Zones
Zones | Dale of Formation | Headquarters | |
1. Southern | 14.4.1951 | Chennai | |
2. Central | 05.11.1951 | Mumbai (CST) | |
3. | Western | 05.11.1951 | Mumbai (Churchgate) |
4. | Northern | 14.04.1952 | New Delhi |
5. | North-Eastern | 14.04.1952 | Gorakhpur |
6. | South Eastern | 01.08.1955 | Kolkata |
7. | Easte rn | 01.08.1955 | Kolkata |
8. | North-Eastern Frontier | 15.01.1958 | Maligaon (Guwahati) |
9. | Sou th-Central | 02.10.1966 | Secunderab ad |
10. | East Central | 01.10.2002 | Hajipur |
11. | North-Western | 01.10.2002 | Jaipur |
12. | East Coast | 01.04.2003 | Bhubaneshwar |
13. | North Central | 01.04.2003 | Allahabad |
14. | South-East Central | 01.04.2003 | Bilaspur |
15. | South Western | 01.04.2003 | Hubli |
l(i. | West Central | 01.04.2003 | Jabalpur |
17. | Metro Railway, Kolkata | 31.12.2010 | Kolkata |