Sources of Irrigation
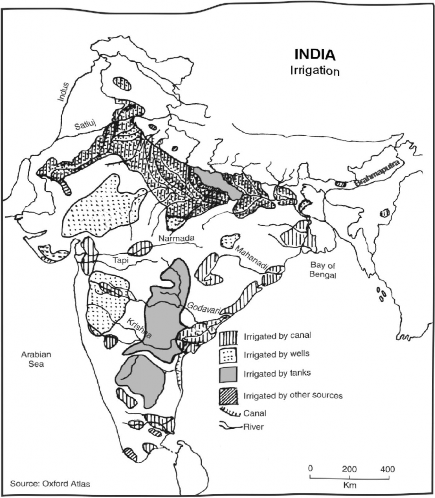
Depending on the availability of surface and underground water, slope of the land, nature of the soil and the types of crops grown in a region, a number of sources of irrigation are utilised. The main sources of irrigation used in different parts of the country arc: (i) canals, (ii) wells and tube-wells, (iii) tanks, and (iv) other sources (springs, kuhls, swing-basket, dhenkli, dongs, and bokka, etc.). The areas irrigated by the different sources have been plotted in Fig. 9.6 while Table 9.8 gives the temporal changes in the irrigated area under different sources.

Fig. 9.6 Sources of Irrigation (2005-06)
Table 9.8 Area and Sources of Irrigation (area in thousand hectares)
Year | Canals | Wells, including tube wells | Tanks | Other sources | Total^^---' |
1950-51 | 8295 | 5980 | 3610 | 970 | 18,855 |
(44.0%) | (31.7%) | (19.1%) | (5.20%) | (32.0 %) | |
1990-91 | 16,560 | 34,580 | 2575 | 3050 | 56,765 |
(29.17%) | (60.91%) | (4.53%) | (5.37%) | (55.7%) | |
2000-01 | 15,790 | 33,275 | 2525 | 2900 | 54,490 |
(28.98%) (61.07%) | (4.63%) | (5.32%) | (100.00%) | ||
Source: Statistical Abstracts of India, 2005-06.
It may be seen from Table 9.8 that only 18,855 thousand hectares of the cropped area was under irrigation in 1950-51 which increased to 54,490 thousand hectares in 2000-01, an increase of almost three times. While the canal area has been doubled over the given period, the area under wells and tube-well irrigation has increased by more than ten times. Despite these achievements, a lot of area of the agricultural land of the country is un-irrigated and needs a controlled and assured supply of moisture to the crops through irrigation.
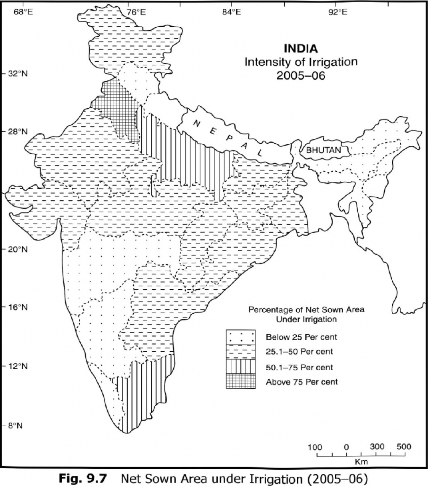
The statewise net sown area under irrigation has been plotted in Fig. 9.7. An examination of Fig. 9.7 shows that Punjab and Haryana have the highest percentage of irrigated area (over 85 per cent) followed by Uttar Pradesh and Tamil Nadu—between 50 to 75 per cent. In the remaining states the irrigated area is below 50 per cent (Fig. 9.7).

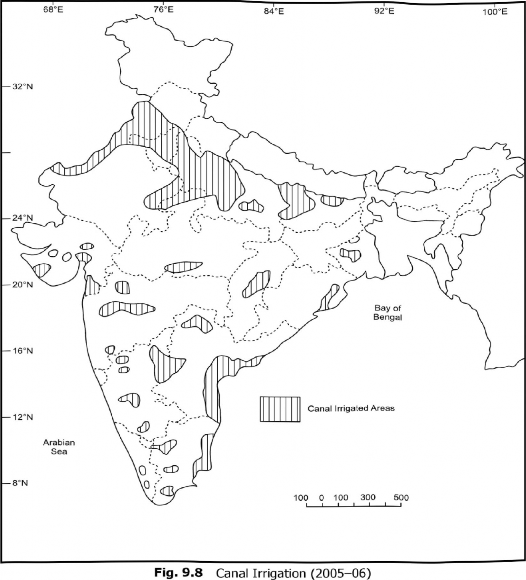
Canal Irrigation Canals used to be the main source of irrigation in 1950-51, irrigating almost 50 per cent of the total irrigated area, but in the Third and Fourth Five-Year Plans, there was a tremendous increase in the tube-well irrigated area. Consequently, the percentage of canal irrigated area declined to less than 29 per cent and in 2000-01, wells and tube-wells emerged as the major source of irrigation, covering over 61 per cent of the irrigated area.
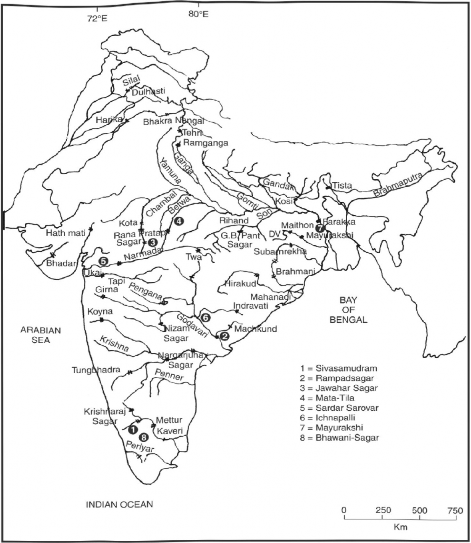
Canals are an effective source of irrigation in the areas of low and leveled relief, productive plain areas where perennial source of surface tlrainage is available. These conditions are ideally found in the Northern Plains of India, Kashmir and Manipur Valleys and the Eastern Coastal Plains of India. The main concentration of canals in India is found in Uttar Pradesh, Punjab, Haryana, and western Rajasthan. After the construction of multi purpose projects, a number of small canals have been dug in the Damodar, Mahanadi, Godavari, Krishna, Kaveri, Narmada, Tapi rivers, and their tributaries. Some of the important irrigation projects have been shown in Fig. 9.9.
Table9.9 Net Area under Canal Irrigation—(2000-01)
5. No. | State | Net area under canal irrigation (‘000 hectares) | Percentage of canal irrigated area to net irrigated area of the state/country | Percentage of canal irrigated area in the state to total irrigated area of India |
1 | Uttar Pradesh | 3090 | 25.42 | 21.33 |
2 | Andhra Pradesh | 1650 | 36.42 | 10.83 |
3 | Haryana | 1475 | 49.89 | 9.68 |
4 | Rajasthan | 1355 | 27.59 | 8.90 |
5 | Bihar | 1135 | 31.34 | 7.45 |
6 | Maharashtra | 1050 | 35.38 | 6.89 |
7 | Karnataka | 975 | 36.55 | 6.40 |
8 | Odisha | 875 | 24.38 | 5.74 |
9 | Tamil Nadu | 830 | 28.81 | 5.44 |
10 | Madhya Pradesh | 825 | 19.49 | 5.41 |
11 | Chhattisgarh | 800 | 68.90 | 4.25 |
12 | Punjab | 675 | 18.76 | 4.43 |
13 | Gujarat | 495 | 16.52 | 3.25 |
India | 15,230 | 29.24 | 100.00 |
Source: Statistical Abstracts of India-2003.
It may be seen from Table 9.9 that in India, about a little over 29 per cent of the total irrigated area was under canal irrigation. I Jttar Pradesh with 3090 thousand hectares under canals has the first rank in canal irrigation, followed by Andhra Pradesh with 1650 thousand hectares and Haryana w ith 1475 thousand hectares. The states of Rajasthan and Bihar rank fourth and fifth in canal irrigated area. The rank of Punjab was however, 12th in canal irrigation, followed by Gujarat (Table 9.9).
The existing irrigated area and the sources of irrigation are not adequate to meet the growing demand. There are a number of problems Indian agriculture is facing. There is a gap between the developed and utilised irrigation potential. Moreover, in the case of big irrigation projects like canals, there are interstate disputes. There is wastage of water, water-logging in canal command areas and other ecological problems. Hence, there is a need for a judicious and scientific development of irrigation, full utilisation of its potential and rational pricing of irrigation water.

Wells and Tube-Wells This type of irrigation has been practised in India since the time immemorial. The widely used methods for the utilization of underground water are persian-wheel Rahal Charas, or mot and tube-wells. Out of these, tube-well irrigation is more popular in the Satluj-Ganga plains. Tube- well irrigation accounts for more than 61% of the total irrigated area of the country.

Fig. 9.9 Major Irrigation Projects
Tube-well irrigation is the easiest source of irrigation. It can be installed in a short duration of time. It is however, expensive and diminishes the underground watertable, especially in the years of drought like 2009. The most important problem of tube well irrigation is the high energy costs for pumping groundwater because of farmers dependence on diesel and electricity. The prices of these energy resources have increased rapidly. The largest area under tube-well irrigation is in Uttar Pradesh followed by Rajasthan, Punjab, Madhya Pradesh, Gujarat, Bihar, Andhra Pradesh and Haryana.
Tank Irrigation In some parts of the country, especially in the peninsular India tank is an important source of irrigation. About 4% of the total irrigated area is under tank irrigation. Andhra Pradesh (32%) has the largest area under tanks followed by Tamil Nadu (28%), West Bengal (14%), Karnataka (9.3%), U.P. (7%),
M.P. (6.5%), Odisha and Maharashtra. Many of the tanks however, dry up during the summer season when more irrigation is required. It is an expensive and time-consuming technique which can command only small area.
Power Availability of electric power is also an important determinant of cropping patterns and agricultural productivity. In general higher the supply of electricity for irrigation, higher is the yield of crops.
Roads A well knit and co-ordinated network of metalled roads play a significant role in the agricultural development of a region. In India, the road density is the highest in Punjab, Haryana and Kerala these states have higher yields of cereals to that of the national average.
Credit The cultivator needs credit for a variety of purposes and for diff erent periods. Firstly, he needs short-term credit (up to 15 months) for the purchase of requirements of current production, (seeds, fertilisers, insecticides, pesticides, electricity, diesel, cattle-feed, repair of farm implements, wages to hired labourers, etc.) and to meet the consumption needs of his family till the harvest of the crop. Secondly, he requires medium-term finance (up to 5 years) for such purposes as buying cattle and implements, undertaking digging of wells or other minor irrigation works, and effecting substantial improvement to land. Finally, he requires long term finance (for over 5 years) for such purposes as purchase of land, substantial investment in tube-wells, farm machinery and orchards, and the repay of old loans.
In the absence of this facility, the cultivators mostly used to borrow from the private money lenders, traders, commission agents and relatives. The All India Credit Survey 1951-52 showed that of the total rural credit secured by the cultivators, money lenders accounted for almost 70 per cent, relatives 14.2 per cent,
traders and commission agents 5.5 per cent, co-operatives 3.1 per cent, government agencies 3.3 per cent, and others 4.2 per cent. This led to a lot of exploitation of the cultivators by money lenders charging exorbitant interest, illegally and fraudulently grabbing the property of the borrower and forcing him to act as bonded labour. At present, farmers are getting agricultural credit facilities through co-operatives, commercial banks and regional rural banks.
The National Bank for Agricultural and Rural Development (NABARD) founded on 2ndJuly, 1982 took over the functions of the erstwhile Agriculture Credit Development, Rural Planning, and Credit Cell of the Reserve bank of India and Agriculture Refinance and Development Corporations. The NABARD was established for providing credit for promotion of agriculture, small scale industries, handicrafts and other economic activities in rural areas. It has been emphasised that the largest proportion of the agricultural credit should go to marginal and small farmers.
Research and Extension Development of new seeds and extension service also enhance significantly aggricultural productivity. According to agronomists the HYVs become outdated after every three years. The old seeds need to be replaced by new varieties, for which research and extension services are required.
