
Population pyramid of India through years
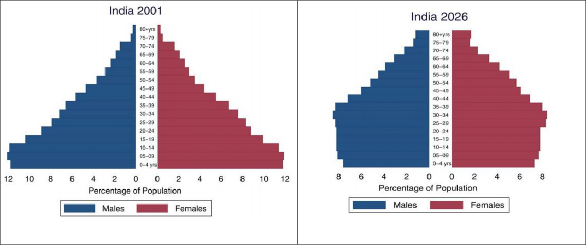
These pyramids show the effect of a gradual fall in the birth rate and rise in the life expectancy. As more and more people begin to live in an older age, the top of the pyramid grows wider. As relatively fewer new births take place, the bottom of the pyramid grows narrower. But the birth rate is slow to fall, so the bottom doesn’t change much between 1961 and 1981. The middle of the pyramid grows wider and wider as its share of the total population increases. This creates a ‘bulge’ in the middle age groups that is clearly visible in the pyramid for 2026. This is what is referred to as the ‘demographic dividend’.