
A. Gini Coefficient/ Gini Index
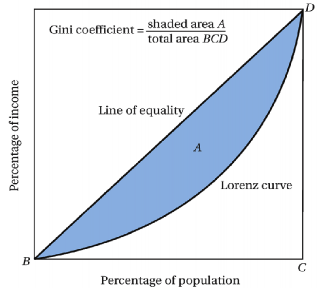
Gini coefficient is the most widely used measure of inequality. It is based on Lorenz curve. The Lorenz curve plots percentiles of the population on the horizontal axis and corresponding cumulative income or wealth on the vertical axis.
The Lorenz curve is often accompanied by a straight diagonal line with a slope of 1, which represents perfect equality in income or wealth distribution; the Lorenz curve lies beneath it, showing the
actual distribution. Gini coefficient is the area between the straight line and the curved line which is expressed as a ratio of the area under the straight line. A coefficient of 1 means that one person earns all of the income or holds all of the wealth, while zero represents that everyone has the same income, i.e. perfect equality.
World Bank data reveals that inequality in India is on the rise with all-India Gini coefficient increasing from 0.30 in 1983 to 0.36 in 2011-12. As per United Nations, the Gini coefficient of income inequality for India fell from 0.36 in 2010 to 0.33 in 2015.