Poverty Estimation in Independent India
In 1962, the Planning Commission constituted a working group to estimate poverty nationally, and it formulated separate poverty lines for rural and urban areas – of Rs 20 and Rs 25 per capita per year respectively. VM Dandekar and N Rath made the first systematic assessment of poverty in India in 1971, based on National Sample Survey (NSS) data from 1960-61. They argued that the poverty line must be derived from the expenditure that was adequate to provide 2250 calories per day in both rural and urban areas. This generated debate on minimum calorie consumption norms while estimating poverty and variations in these norms based on age and sex.
Alagh Committee (1979): In 1979, a task force constituted by the Planning Commission for the purpose of poverty estimation, chaired by YK Alagh, constructed a poverty line for rural and urban areas on the basis of nutritional requirements.
Lakdawala Committee (1993): In 1993, an expert group constituted to review methodology for poverty estimation, chaired by DT Lakdawala, made the following suggestions:
1. Consumption expenditure should be calculated based on calorie consumption as earlier;
2. State specific poverty lines should be constructed and these should be updated using the Consumer Price Index of Industrial Workers (CPI-IW) in urban areas and Consumer Price Index of Agricultural Labour (CPI-AL) in rural areas;

3. Discontinuation of ‘scaling’ of poverty estimates based on National Accounts Statistics. This assumes that the basket of goods and services used to calculate CPI-IW and CPI-AL reflect the consumption patterns of the poor.
Tendulkar Committee (2009): In 2005, another expert group to review methodology for poverty estimation, chaired by Suresh Tendulkar, was constituted by the Planning Commission to address the following three shortcomings of the previous methods: (i) consumption patterns were linked to the 1973-74 poverty line baskets (PLBs) of goods and services, whereas there were significant changes in the consumption patterns of the poor since that time, which were not reflected in the poverty estimates; (ii) there were issues with the adjustment of prices for inflation, both spatially (across regions) and temporally (across time); and (iii) earlier poverty lines assumed that health and education would be provided by the State and formulated poverty lines accordingly.
It recommended four major changes:
1. Using Mixed Reference Period (MRP) based estimates, as opposed to Uniform Reference Period (URP) based estimates that were used in earlier methods for estimating poverty.
2. A uniform poverty line basket (PLB) across rural and urban India;
3. A change in the price adjustment procedure to correct spatial and temporal issues with price adjustment; and
4. Incorporation of private expenditure on health and education while estimating poverty.
It based its calculations on the consumption of the following items: cereal, pulses, milk, edible oil, non-vegetarian items, vegetables, fresh fruits, dry fruits, sugar, salt & spices, other food, intoxicants, fuel, clothing, footwear, education, medical (non-institutional and institutional), entertainment, personal & toilet goods, other goods, other services and durables. The Committee computed new poverty lines for rural and urban areas of each state. To do this, it used data on value and quantity consumed of the items mentioned above by the population that was classified as poor by the previous urban poverty line. It concluded that the all India poverty line was Rs 446.68 per capita per month in rural areas and Rs 578.80 per capita per month in urban areas in 2004-05.
The following table outlines the manner in which the percentage of population below the poverty line changed after the application of the Tendulkar Committee’s methodology.
Committee | Rural | Urban | Total |
Lakdawala Committee | 28.3 | 25.7 | 27.5 |
Tendulkar Committee | 41.8 | 27.5 | 37.2 |
Table: Percentage of population below poverty line calculated by the Lakadwala Committee and the Tendulkar Committee for the Year 2004-05 | |||
The Committee also recommended a new method of updating poverty lines, adjusting for changes in prices and patterns of consumption, using the consumption basket of people close
to the poverty line. Thus, the estimates released in 2009-10 and 2011-12 use this method instead of using indices derived from the CPI-AL for rural areas and CPI-IW for urban areas as was done earlier. Table below outlines the poverty lines computed using the Tendulkar Committee methodology for the years 2004-05, 2009-10 and 2011-12.
Year | Rural | Urban |
2004-05 | 446.7 | 578.8 |
2009-10 | 672.8 | 859.6 |
2011-12 | 816.0 | 1000.0 |
Table: National poverty lines (in Rs per capita per month) for the years 2004-05, 2009-10 and 2011-12 | ||
Rangarajan Committee: In 2012, the Planning Commission constituted a new expert panel on poverty estimation, chaired by C Rangarajan. The Rangarajan committee estimation is based on an independent large survey of households by Center for Monitoring Indian Economy (CMIE). It has also used different methodology wherein a household is considered poor if it is unable to save.
The methods also include certain normative levels of adequate nourishment, clothing, house rent, conveyance, education and also behavioral determination of non-food expenses. It also considered average requirements of calories, protein and fats based on ICMR norms differentiated by age and gender.
According to the report of the committee, the new poverty line was set at Rs 32 in rural areas and Rs 47 in urban areas. The earlier poverty line figure was Rs 27 for rural India and Rs 33 for Urban India (see following table).
No. of Rural poor | No. of urban poor | Total | Percent of poor in the year 2011-12 | |
Rangarajan Committee | 260.5 million | 102.5 million | 363 million | 29.5% |
Tendulkar committee | 216.5 million | 52.8 million | 269 million | 21.9% |
Hashim Committee- The Hashim Committee in its 2012 report recommended three stage identification process to identify the families living Below Poverty Line in urban areas which include automatic exclusion, automatic inclusion and scoring index of the remaining urban families in this order. The methodology recommended mainly emphasizes on capturing residential, social and occupational vulnerabilities.
Saxena Committee- Dr. N.C. Saxena Committee was set up by the Ministry of Rural Development to advise it on the suitable methodology for BPL Census and not for estimation of poverty. However, in the Report submitted by the Expert Group on 21st August 2009 it was mentioned that the percentage of people entitled to BPL status should be revised upwards to at least 50%.
1.4. Multidimensional Poverty
“What use is equality before law if there is no equality in fact? Freedoms guaranteed by Article 19 will become empty slogans for a person who has no food to eat, no roof under which he can take shelter and no clothes to wear; and what is the use of vote to a person who is hungry and kept illiterate and denied the knowledge required to participate in the affairs of the State?” - Justice K. S. Hedge.

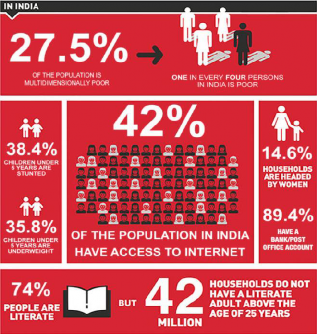
The above quote drives home the point that poverty is not only economic hardship but it affects other aspects of life hampering overall growth of poor. The United Nations in the Sustainable Development Goal 1, also, calls to eradicate poverty in all its forms everywhere. In this context, traditional poverty measures – often calculated by numbers of people who earn less than a certain income level – shed light on how little people earn but not on whether or how they experience poverty in their day-to-day lives.
The Multidimensional Poverty Index helps answer that call, providing immensely valuable information for all those seeking to understand what poverty looks like for a particular place
or group of people, and for those working on the policies to help people escape poverty now and into the future.
